There is disagreement among economists about the causes of price inflation, with the discussion focusing on issues such as the money supply (quantity theory), the relation between unemployment and inflation (Phillips curve, NAIRU), and the occurrence of wage-price spirals (conflict theory).
Who's right?
Something you cannot ignore when looking for the answer on this question is that inflation is caused by sellers1 who raise their prices. So, if you want to understand what causes inflation, then must determine why these sellers$ do raise their prices.
1: those sellers include all actors in the production and distribution chain, from producers and supplier of raw materials to producers and suppliers of intermediate products to producers and suppliers of finished products.
In this first article I will map out what these prices in the aggregate are made up of, because this information forms the basis for this determination, and therefore for answering the question above.
Remarkably, as far as I can tell, no one has ever done this exercise in this detail before. It is important to realize yourself that this article is not about theoretical considerations, but about simple observations.
First, a definition: price inflation (further: inflation) is defined here as the weighted average price increase of a certain collection (‘basket’) of products. For example, the price increase of a basket of raw materials, or intermediate products, or a basket of final products such as consumer products.
And second, a simple observation: there are only two reasons for sellers to increase their prices, the first is to pass on to customers an increase in the cost price of their products, and the second is to try2 to increase their profit margin.
2: one should realise that those sellers cannot increase their profit margin in advance (a priori). They can only increase the prices of their products. The profit margin that they will eventually (a posteriori) have achieved, will be determined by the difference between these prices and the cost price of their products. And this will also depend on the volume of their sales, and thus on the response of their customers to these price increases.
In the following text I will focus myself to domestic inflation in the USA, comprising the weighted average price increase of a basket that includes all final products sold in the USA, as an example.
The composition of prices
At the level of the individual producer, the prices of specific products can be divided into the following five cost components:
• labour costs
• purchase costs of intermediate products
• depreciation costs (wear / aging of productive assets)
• product-related tax costs (product-related taxes minus product-related subsidies)
• balance: profit costs (operating surplus)3
3: Their profits are of course not a cost component for the sellers of these products, but being a part of the product price, they are for their buyers. Therefore I will use the term profit costs.
For a closed economic system, the component purchase costs of raw materials and intermediate products can be omitted because it can also be split into labor, depreciation, tax and profit costs, namely those of the manufacturers of these products. This means that in the aggregate, the price of the final production of such a system can be reduced to four main cost components:
• labour costs
• depreciation costs
• tax costs
• profit costs
However, for a specific region or country (an open economic system), a fifth cost component must be added, namely the cost component net import costs, which are the costs of imported products minus the proceeds of exported products - also see the derivation below.
All in all, this means that the aggregate prices of final products sold in an open economic system can be broken down into five main cost components:
• labour costs
• depreciation costs
• tax costs
• profit costs
• net import costs (= import costs – proceeds of exports)
In equation form:
Aggregate domestic final sales = L + T + F + D + IM - X (1)
with L: labour costs, T: taxes on production and imports minus subsidies on production and imports, F: profit costs, D: depreciation costs, IM: import costs and X: proceeds of exports.
The derivation of equation 1
Equation 1 can be derived from the following two standard definitions for economic production, viewed from the expenditure side (gross domestic product: GDP) and from the income side (gross domestic income: GDI). Bear in mind that what someone spends by definition constitutes the income of the others:
Gross Domestic Product (GDP) = C + I + G + X - IM (2)
Gross domestic income (GDI) = L + T + F + D (3)
with C: private consumption, I: private investments, G: government spending.
For domestic aggregate final sales the following applies by definition:
Aggregate domestic final sales = C + I + G (4)
And because, as said, GDP ≡ GDI, it follows that:
C + I + G + X - IM = L + T + F + D (5)
C + I + G = L + T + F + D + IM - X (6)
Aggregate domestic final sales = C + I + G = L + T + F + D + IM – X (7)
With which equation (1) is retrieved.
The US example: the NIPA system
In the US, the statistics relating to the income from the final economic production (GDP) and the distribution of that income (GDI) are referred to as the National Income and Product Accounts (NIPA). They are supplied by the Bureau of Economic Analysis (BEA).
The following table, derived from NIPA Tables 1.10 (subdivision of GDI in types of income) and 1.1.5 (subdivision of GDP in types of expenditure) specifies the five cost components listed above for the US in 2021, as an example. The definitions of the components used by the BEA are listed in Annex 1.
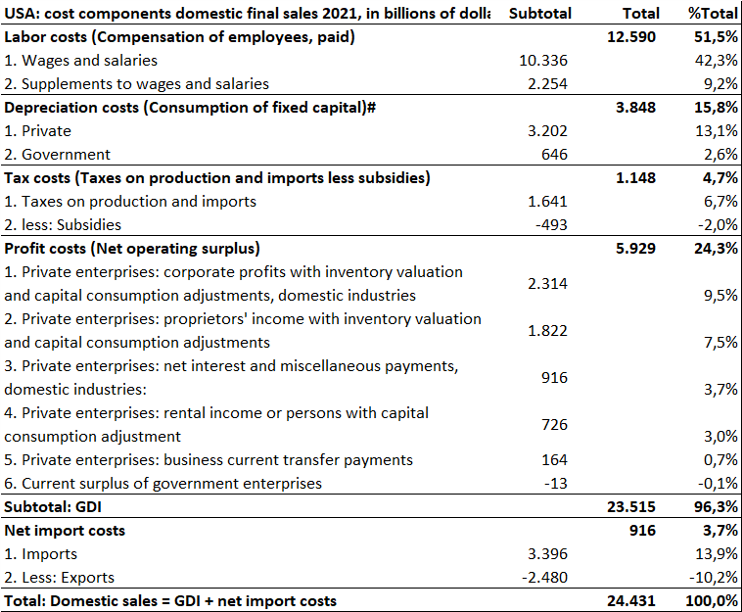
#: It should be noted that in the NIPA, productive assets are not depreciated on the basis of their historical purchase costs, but on the basis of the development of their current value. To make that distinction, the term ‘consumption of fixed capital’ is used in the NIPA system instead of the term ‘depreciation’. For the sake of simplicity, I will stick to the term depreciation costs, but I actually mean consumption of fixed capital.
The cost components labour costs, depreciation costs, tax costs and net import costs as listed in the table above are more or less self-explanatory (also see Appendix 1). But that does not apply to the component profit costs. Because the structure of the national account system is more complex than was outlined in the previous text, the component profit costs comprises more than just the profits of the sellers of (final) products, and is separated in the following items (for more details, see Appendix 1):
1. Corporate profits with inventory valuation and capital consumption adjustments, domestic industries: profit made by non-personal (corporate) private domestic companies, after deduction of depreciation costs, inventory revaluations and net interest payments.
2. Proprietors' income with inventory valuation and capital consumption adjustments: profit made by personal (non-corporate) private domestic companies, after deduction of depreciation costs, inventory revaluations and net interest payments.
3. Net interest and miscellaneous payments, domestic industries: net interest payments (interest paid minus interest received) by private domestic companies. These interest payments include both the (monetary) interest paid and received in the form of money, and the estimated monetary value of interest paid and received in the form of services (imputed interest#). This item also includes net interest paid on home mortgages, because in the NIPA, home ownership by people who do not primarily earn their income from renting (including those who live in their own house, also see the following item Rental income) is regarded as a business. Furthermore, this item also includes rents and royalties, which are payments from private companies to the government, in particular for concessions for the extraction of raw materials.
4. Rental income or persons with capital consumption adjustment: net income from ownership by persons who do not primarily receive their income from rental. This income also includes the notional income of people living in their own home, as if they were letting their home to themselves: Imputed Rental Income5. It also includes income from other ownership such as patents, copyrights and rights to natural resources, but these account for only c.3% of this item.
5. Business current transfer payments: payments for which there are no current counterparts. Includes, among other things, damage claims with insurers based on previously paid premiums, and payments of imposed fines.
6. Current surplus of government enterprises: net income from government companies, including subsidies to government companies received from governments.
5: The BEA provides the following substantiation for these imputations (BEA, 2017):
“The largest NIPA imputation is that made to approximate the value of the services provided by owner-occupied housing. This imputation is made so that the treatment of owner-occupied housing in the accounts is comparable to that for tenant-occupied housing (which is valued by rent paid), thereby keeping GDP invariant as to whether a house is owned or rented. In the NIPAs, the purchase of a new house (excluding the value of the unimproved land) is treated as an investment, the ownership of the home is treated as a productive enterprise, and a service is assumed to flow, over its economic life, from the house to the occupant. For the homeowner, the value of this service is measured as the income the homeowner could have received if the house had been rented to a tenant.
Another large imputation is that made to account for services (such as checking account maintenance and loan services to borrowers) provided by banks and other financial institutions, either without charge or for a small fee that does not reflect the entire value of the service. For the depositor, this “imputed interest” is measured as the difference between the interest paid by the bank and the interest that the depositor could have earned by investing in “safe” government securities (referred to as the “reference rate”). For the borrower, it is measured as the difference between the interest charged by the bank and the interest the bank could have earned by investing in those government securities.”
Items 1 and 2 both concern profits of companies. They will therefore be merged into one post. The third and fourth item are quite different from the first two and from each other, and are therefore both maintained. The fifth and sixth item are relatively small (less than 1% of the total together), and are therefore combined into one “other” component, without further explanation.
A complication in merging items 1 (corporate profits) and 2 (proprietors' income) is that they are not directly addable. The corporate profits item is after deduction of labour costs, but the proprietors' income item includes both a labor component and a profit component, because the business owners in question have opted for a personal business form, which means that they are not formally hired as employees by their company and therefore do not receive wages. Instead, the profit from their business form their income.
A possible approach to solve this problem is to add proprietors' income entirely to labour costs. But that most likely results in an overestimation of labour costs, because it is not likely that the entrepreneurs in question would have received the same income if they had been employed by a company for the same work. And the obvious alternative, adding the proprietors' income entirely to profits, will probably result in an overestimate of the profits, for the same reason.
I have therefore chosen to split item 2 (proprietors' income) into a labor share and a profit share. A simple and straightforward way to do that is to use the labor share and profit share of corporate companies, as follows6,7:
• labor share non-corporate companies = proprietors' income * compensation of employees, paid / (corporate profits + compensation of employees, paid);
• profit share non-corporate companies = proprietors' income * corporate profits / (corporate profits + compensation of employees, paid).
6: The underlying assumption here is that if the owners of those non-corporate companies would have chosen the form of a corporate company, and would have awarded themselves a competitive wage, their companies would on average have had the same profit margin as these corporate companies .
7: It is likely that this provision will to some extent underestimate the profit share of non-corporate companies, because some of these companies employ people, whose compensation has been deducted as labour costs from the proprietors' income . But in the absence of a better alternative, I have maintained the approach.
NB. The costs for the compensation of employees employed by personal companies (not being owners) also fall under the compensation employees component in the NIPA system.
Cost components and sizes
All in all, the foregoing results in the following breakdown into eight cost components, arranged in order of their size in 2021 in the following table (C: corporate, NC: non-corporate).
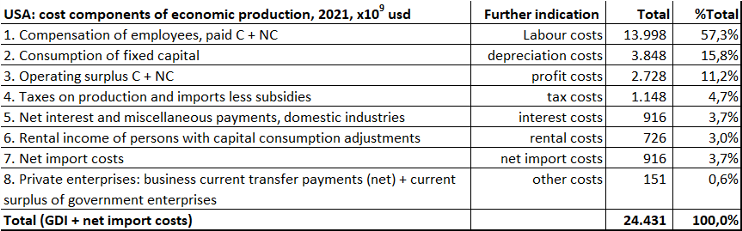
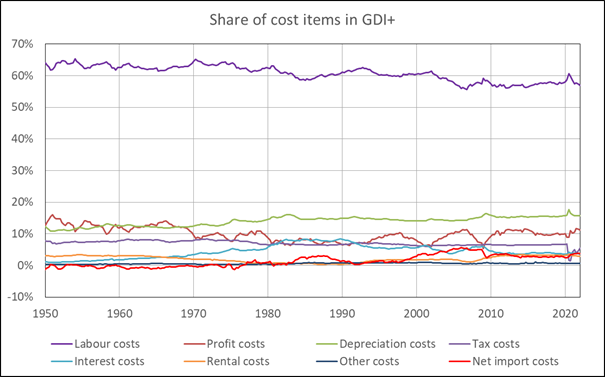
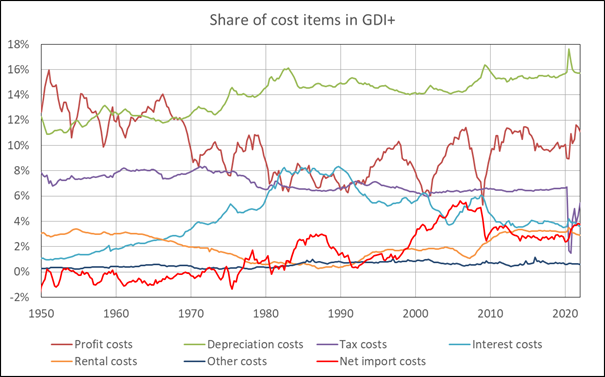
In the following text, I will
further indicate GDI plus net import costs (L + T + F + D + IM – X) as GDI+ and
GDP plus net imports (C + I + G) as GDP+. In the following two graphs, the
shares of the eight cost items are shown, the first including labour costs, and
the second excluding labour costs.
Calculation of domestic inflation based on cost components
As stated before, the focus in this article is on domestic inflation: the weighted average price increase of the aggregate domestic final sales in a certain country. More specifically, what we want to know is, in how far the development of each of the eight defined cost items has contributed to domestic inflation. Note again that:
Aggregate domestic final sales = C + I + G = GDP+ ≡ GDI+ = L + T + F + D + IM - X (7)
With F: the sum of cost items profit costs, rental costs, interest costs and other costs.
The inflation of a cost item A over a period t can be calculated with the following equation:
Inflation of cost item A = Ât = (At / bt - At-1 / bt-1) / (At-1 / bt-1) (8)
In which A represents the nominal value of a specific cost item in periods t and t-1, and b represents a certain basket of products (a real value) for the production of which these costs were made in periods t and t-1.
In order to be able to determine the contribution of each of the defined cost item to domestic inflation, it is therefore necessary to assign each of the cost items to a specific basket of final products, the production of which they enable. For the sub-items import costs and export costs, these are the baskets imported products and exported products (real imports and real exports).
And for the items labour costs, depreciation costs, profit costs, tax costs, interest costs, rental costs and other costs, which together form the aggregate costs of the production of the basket of final domestic products, this is the basket of final domestic products (real GDP).
This leaves us with the calculation of the impact of the inflation of each cost item on domestic inflation. This impact is equal to the inflation  of this cost item, multiplied by the share of this cost item in the proceeds of the final aggregate domestic final sales in the previous period, t-1:
Domestic inflation = Σ Ât · SAt-1 (9)
As C + I + G should equal L + T + F + D + IM – X, the calculated inflation based on C + I + G (further referred to as ‘GDP+ inflation’) should equal the calculated inflation based on L + T + F + D + IM – X (further referred to as ‘GDI+ inflation’).
The results of both calculations are shown in the following graph. The calculation of CIG-inflation is based on the variable Gross domestic purchases in NIPA tables 1.17.5 (nominal) and 1.17.6 (real), the calculation of LTFDIMX-inflation on the nominal values of the cost components as described above and the real values of Gross domestic income in NIPA table 1.17.6, and Imports and Exports on NIPA tables 1.1.5 (nominal) and 1.1.6 (real), using the equations 8 and 9 above.
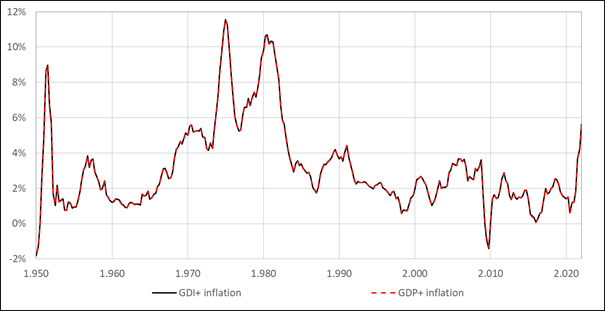
As can be seen in the figure above, GDP+ inflation and GDI+ inflation are indeed equal (in fact almost equal, in connection with statistical discrepancies). In the following graph, GDI+ inflation is compared to GDI inflation and GDP inflation (both based on nominal and real GDI- and GDP-values in the NIPA tables 1.1.5 and 1.1.6).
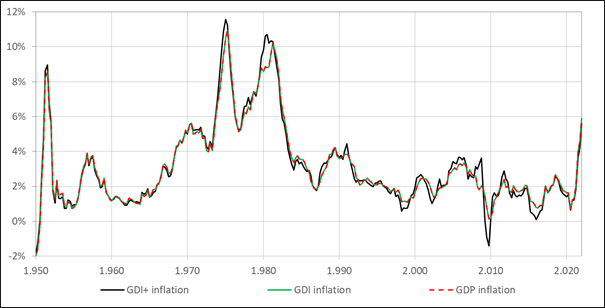
As is shown in the figure above, GDI inflation and GDP inflation are (again almost) equal, as expected. The figure also shows that GDI+ inflation follows GDI and GDP inflation quite well until c. 1970, after which it starts to deviate. The reasons for this increasing deviation is the increasing share of both imports (as an addition) and exports (as a subtraction) in GDI+:
GDI = L + T + F + D (3)
GDI+ = L + T + F + D – X + IM (7)
Inflation contribution per cost component in the US
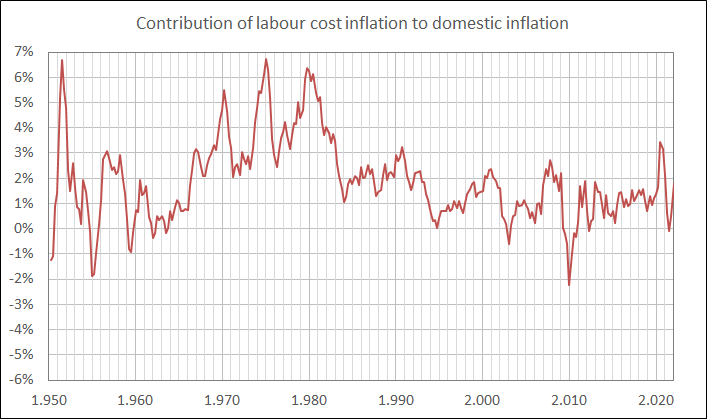
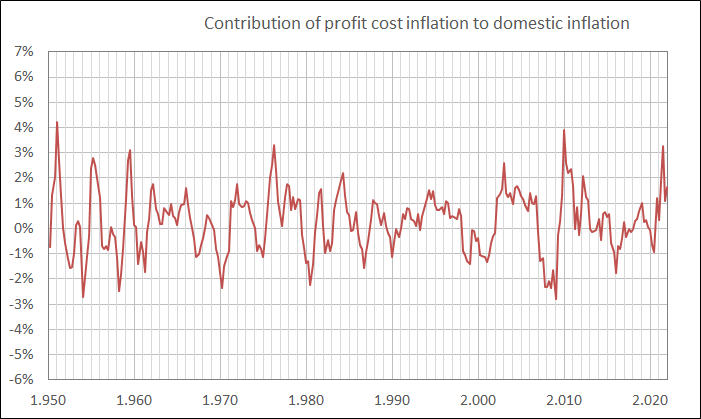
The inflation contribution of each of the cost components is shown in Appendix 2.
The following table shows the average y-o-y contribution of each cost component to domestic inflation for the period 1950 – Q4 2021, arranged by size. The standard deviations of the contributions are shown on the right in the table. As a comparison, the average inflation shares of each item are compared to the average shares of each item in in GDI+.
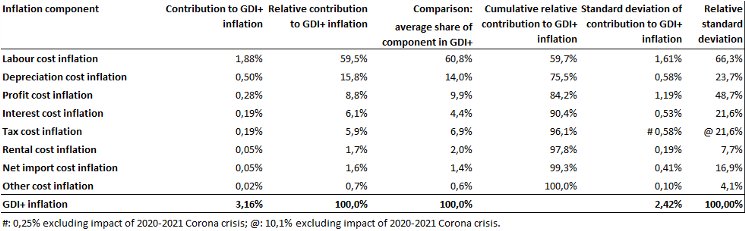
The table shows that the sum of inflation contribution of labour cost, depreciation cost and profit cost in the period 1950 – Q3 2020 (column 5) accounts for approx. 84% of the total domestic inflation, and c. 96% if you also include interest cost and tax cost. The inflation contribution of net import cost, rental cost and other cost accounts for the remaining c. 4%.
However, this picture is somewhat distorted, since the variability of a number of the latter five items is, on average, relatively strong (column 7), so that the impact of these items on changes in inflation can be much greater than their average contribution may suggest. As can be seen in the table, this is especially true for the variability of the inflation contribution of the items interest cost, net import cost and tax cost (the latter mainly caused by an extreme spike during the 2020 Corona crisis, see below).
From equations 8 and 9 it follows that the average share of the contribution of each of the cost items to domestic inflation (column 2) should be more or less equal to their average shares in GDI+ (column 3), unless there is a systematic trend of significantly increasing or decreasing values of these shares, which is generally not the case.
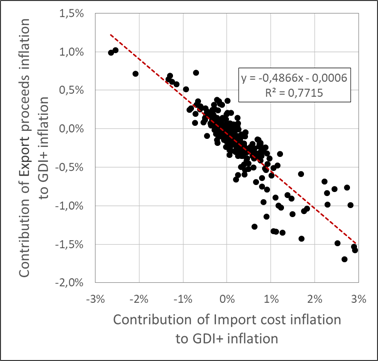
The limited contribution of net import cost inflation
It is striking that net import cost inflation (imported inflation minus exported inflation) only comes in seventh place in the weighted inflation ranking in the previous table (although it scores higher in terms of variability), because imported inflation is often cited as an important source of domestic inflation (reference). That this contribution is so limited is mainly due to the fact that the contributions of imported and exported inflation are strongly negatively correlated. This is evident from the following figure (period 1950-2021), on the basis of which the contribution of imported inflation was on average c. 50% offset by exported inflation.
The complete inflation picture
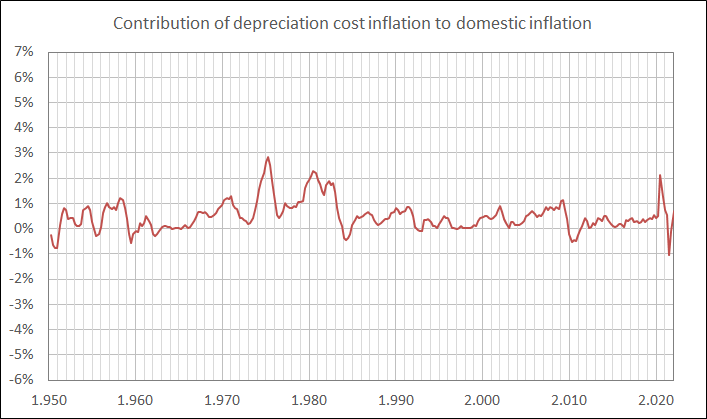
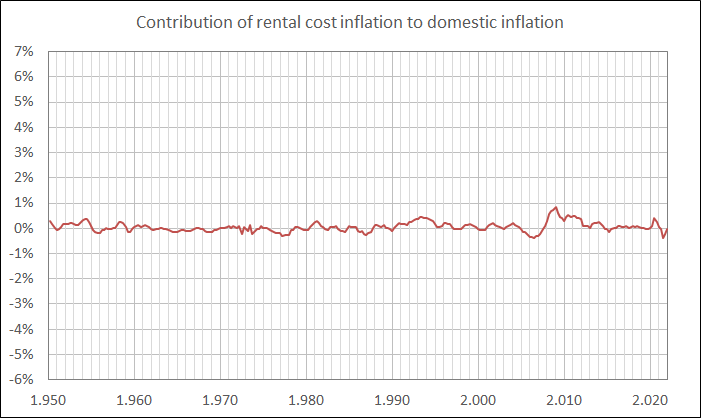
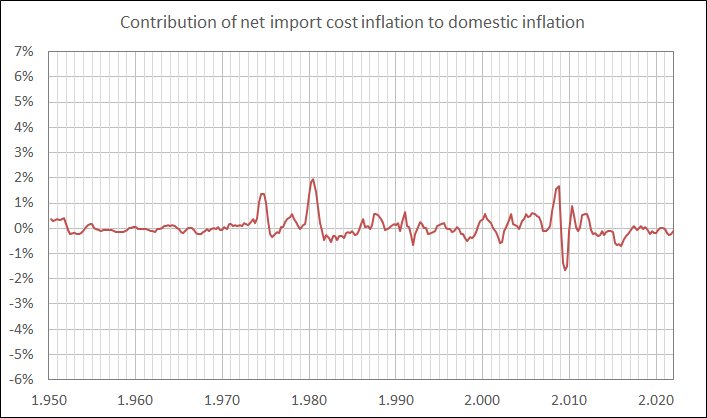
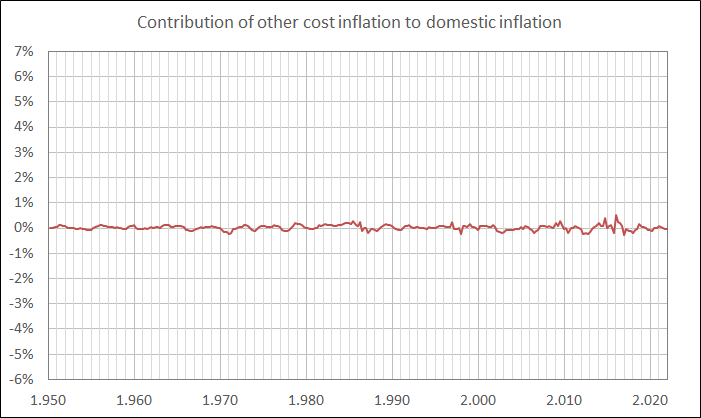
The contribution of the eight cost components to domestic inflation is shown in the following figure.
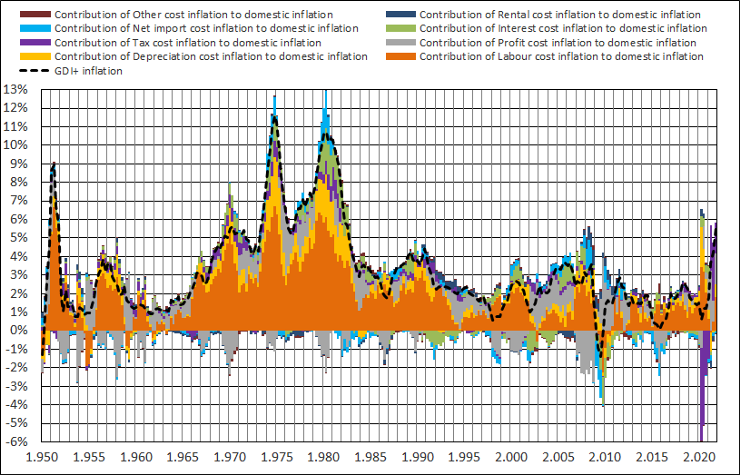
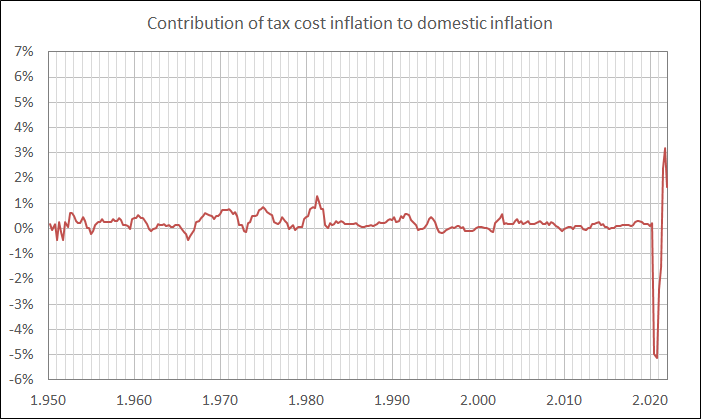
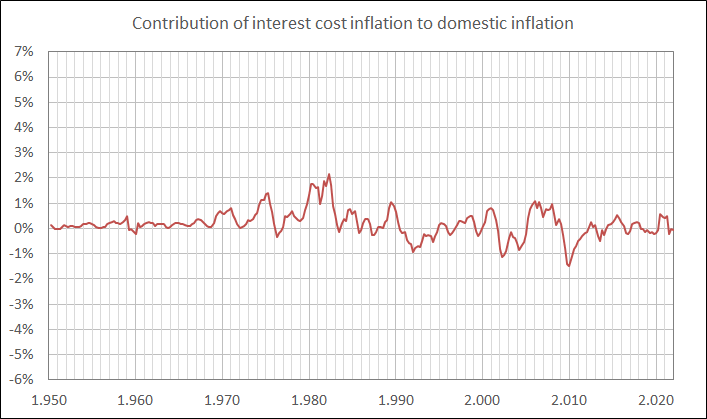
The figure shows that labour cost inflation is usually positive, as are depreciation cost inflation and tax cost inflation (the latter except for the corona crisis in 2020-2021, also see the next figure). However, this does not apply to the other inflation components. In particular profit cost inflation, net import cost inflation and interest cost inflation occasionally show quite negative spikes. The following graph again shows the contribution of the eight cost components to domestic inflation, but now limited to the period 2000-2021.
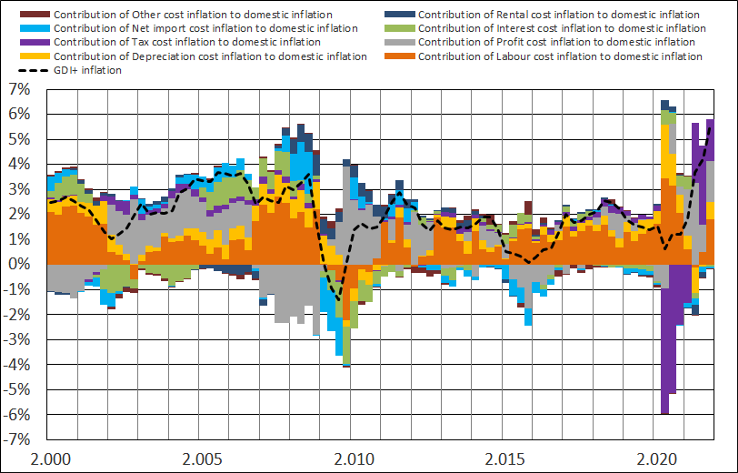
Most striking are the large spikes of tax cost inflation in 2020 (negative) and 2021 (positive) which are due to an large increase in subsidies in 2020 (remember that tax costs are defined as taxes on production and imports less subsidies) followed by a partial normalization of these subsidies in 2021 (after an increase from c. 80 billion USD to c. 1,100-1,200 billion USD in 2020Q2-Q3, subsidies were reduced again to c. 300 billion USD in 2021Q4).
Conclusion
Inflation is caused by the simple fact that sellers raise their prices. This means that if you want to understand what causes inflation, you have to determine why those sellers do rise their prices. It is clear in advance that there are only two reasons for these sellers to do this: to pass on to customers an increase in the cost price of their products, or to try to increase their profit margin. Thus, in order to be able to determine what causes inflation, it is necessary to first identify the components which constitute these prices. This has been done in this article, with the US in 1950 - 2021 as an example.
Based on the National Income and Product Accounts (NIPA) of the Bureau of Economic Analysis (BEA), a total of 8 components of domestic inflation have been identified, which are (in decreasing order of magnitude): labour cost inflation, depreciation cost inflation, profit cost inflation, interest cost inflation, tax cost inflation, rental cost inflation, net import cost inflation and other cost inflation. And as expected, the average shares of these components in domestic inflation are roughly equal to their average shares in domestic income.
More specific, in 1950-2021, the average inflation contribution of labour costs, depreciation costs and profit costs accounted for approximately 84% of domestic inflation, and 96% if tax costs and interest costs are also included, while net import costs, rental costs and other costs contributed for only around 4% of domestic inflation.
However, this picture is somewhat distorted because the contributions of some of the latter five components are quite volatile, so that their impact on domestic inflation can sometimes be significantly greater than their average contribution suggests. This is especially true for the inflation of interest costs, net import costs and (during the Covid19 crisis) the inflation of tax costs.
In this article, the main ingredients of inflation have been identified and quantified for the US in the period 1950-2021. But this does not explain why these ingredients developed as they did. This will be the subject of the following articles.
Appendix 1 - Definitions of relevant NIPA components
Sources: NIPA Handbook - Concepts and Methods of the U.S. National Income and Product Accounts (BEA, October 2016); A Guide to the National Income and Product Accounts of the United States (BEA, November 2017).
Compensation of employees, paid
The total remuneration, both monetary and in kind, payable by employers to employees in return for their work during the period. It consists of wages and salaries and of supplements to wages and salaries (employer contributions for employee pension and insurance funds and employer contributions for government social insurance). In the NIPAs, compensation is presented on an accrual basis—that is, it reflects compensation liabilities incurred by the employer in a given period regardless of when the compensation is actually received by the employee.
Wages and salaries
The total remuneration, in cash and in kind, of employees, including the compensation of corporate officers; commissions, tips, and bonuses; voluntary employee contributions to certain deferred compensation 401(k) plans; employee gains from nonqualified stock options; receipts- in-kind; and miscellaneous compensation of employees, such as judicial fees to jurors and to witnesses.
Supplements to wages and salaries
Consists of employer contributions for employee pension and insurance funds and of employer contributions for government social insurance.
Consumption of fixed capital
The NIPA measure of economic depreciation—that is, the decline in the value of the stock of fixed assets due to physical deterioration, normal obsolescence, and accidental damage except that caused by a catastrophic event. For non-profit institutions serving households and for general government, CFC serves as a measure of the value of the capital services of the fixed assets owned and used by these entities.
Taxes on production and imports less subsidies
Taxes on production and imports
Taxes payable on products when they are produced, delivered, sold, transferred, or otherwise disposed of by their producers (such as federal excise taxes, custom duties, and state and local sales taxes). Also includes other taxes on production, such as taxes on ownership of assets used in production (for example, local real estate taxes, motor vehicle licenses, severance taxes, and special assessments). Does not include personal and corporate income taxes and personal property taxes.
Subsidies
Payments from government agencies to private business (for example, federal subsidies to farmers) and to government enterprises (for example, federal subsidies to state and local public housing authorities) to support their current operations. In contrast, payments associated with the acquisition or disposal of assets are classified as capital transfers.
Net operating surplus
A profits-like measure of the surplus accruing to private and government enterprises from the processes of production before deduction any explicit or implicit interest charges, rent, or other property inomes payable on financial assets, land, or other natural resources required to carry out production. It is equal to gross operating surplus less consumption of fixed capital.
Corporate profits with inventory valuation and capital consumption adjustments, domestic industries
The net income, before taxes, from current production of entities that are treated as corporations in the NIPAs. For corporate businesses, it is defined as gross output less the following expenses: intermediate inputs, compensation of employees, taxes on production and imports (less subsidies), consumption of fixed capital, net interest and miscellaneous payments, and business current transfer payments. The estimates are based on receipts less expenses from corporate income tax returns, with adjustments to account for differences between federal tax law and NIPA concepts. Among these differences are the following: receipts exclude net capital gains and dividends received; expenses exclude bad debt, depletion, and state and local taxes on corporate income; inventory withdrawals are valued at current cost; and depreciation is on a consistent accounting basis and valued at current-replacement cost.
Proprietors' income with inventory valuation and capital consumption adjustments
The current-production income (including income in kind) of sole proprietorships and partnerships and of tax-exempt cooperatives. It excludes dividends and monetary interest received by nonfinancial proprietorships and partnerships (which is considered received by persons) and rental income of persons not primarily engaged in the real estate business. In the NIPAs, estimates are prepared separately for farm and nonfarm proprietors.
Net interest and miscellaneous payments, domestic industries
Net interest: Interest paid by private enterprises less interest received by private enterprises. Consists of monetary and imputed interest payments. Includes interest payments on mortgage and home improvement loans and on home equity loans because home ownership is treated as a business in the NIPAs.
Imputed interest: Imputed interest is made up of 1) imputed income paid to policy holders
by property and casualty insurance companies and life insurance companies, measured as the investment income earned on policyholders’ reserves; 2) implicit services provided by financial intermediaries other than commercial banks, measured as the property income received by them less the interest paid by them to business, households and institutions, governments,
and the rest of the world; and 3) implicit services provided by commercial banks in the form of both depositor and borrower services.
Miscellaneous payments: rents and royalty payments to government.
Rental income of persons with capital consumption adjustment
The net income of persons (except those primarily engaged in the real estate business) from the rental of real property, the imputed net rental income of owner occupants of dwellings, and the royalties received by persons from patents, copyrights, and rights to natural resources.
Net payments by private businesses to persons, to government, and to the rest of the world for which no current services are performed, such as donations by business to charitable organizations. Does not include “capital transfers.”
Surplus of government enterprises
Current operating revenue and subsidies received from other levels of government less current expenses, such as intermediate purchases and employee compensation. In this calculation, no deduction is made for net interest paid, because the interest payments of government enterprises are not separately identified from other government interest in the government receipts and expenditures account.
Net exports
Imports
Goods and services that are sold, given away, or otherwise transferred by foreign residents to U.S. residents.
Exports
Goods and services that are sold, given away, or otherwise transferred by U.S. residents to foreign residents.
Appendix 2 - Inflation contributions of each of the eight cost components
© Anton van de Haar - July 2022